A derivative plot is a slightly different way to look at a traditional Horner plot. The big advantage of a derivative plot over the more traditional well-test analysis plots is that ALL the main well and reservoir characteristics are shown clearly on a single plot. This allows you to associate a pattern in the derivative plot to a particular well and reservoir description. I strongly recommend using the derivative plot; it really helps to improve a well-test analysis! However, don't get carried away; you still need to look at the traditional plots to do a complete analysis.
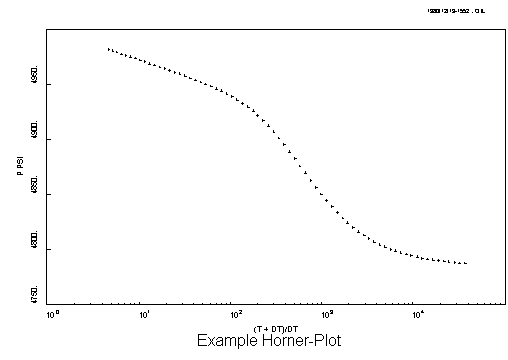
Here is an example of a Horner plot for a well with damage in a simple "infinite-acting" (i.e. no reservoir boundaries) system (time increases to the LEFT). Note the initial "S" shape for the well-bore storage effects followed by a straight-line.

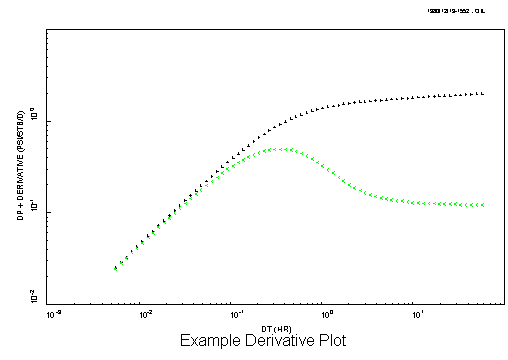
A Derivative plot is displayed on log-log scales and is composed of two curves; an upper curve to plot delta-pressure verses delta-time, and a lower curve to plot the derivative verses delta-time. Why is this lower curve called the "derivative"? Because it is the first derivative of the Horner plot i.e. the instantaneous slope along the curve of the data on a Horner plot. Here is an example of the derivative plot; note how the well-bore storage "S" from the Horner plot becomes a "hump" with an initial UNIT SLOPE, and the straight-line on the Horner plot becomes a STABILISED derivative value.

And that is all there is to it. All of the other traditional plots
(e.g. a square-root plot) will have a characteristic shape on
the derivative plot (e.g. a half-slope).
Q: Get it?