Select the ANALYSIS pull-down menu in PIE and select the "DIAGNOSTIC" option. This will display a set of graphics functions (the floating 'toolbar' at the bottom of the main window) that allow you to draw lines on the derivative plot.
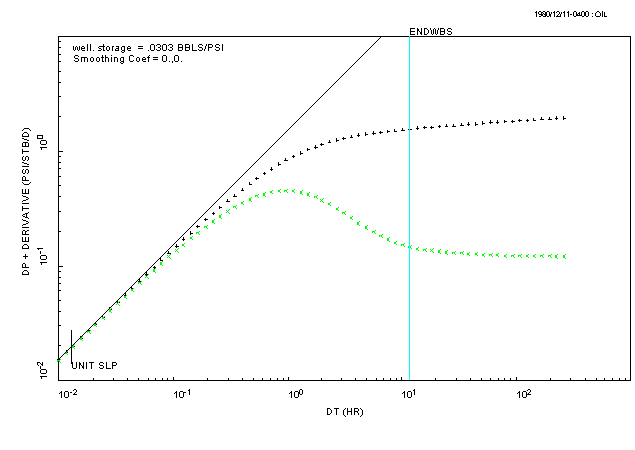
Select the button for the function called "UNITSL" and then move the mouse over the data with a unit-slope and click on one of these data points. The end result should look something like this:

There should be a unit-slope line drawn through the data points with a unit slope, and a vertical line indicating where the end of well-bore storage effects occurs. In theory, the data after the end of well-bore storage effects is the data that you can analyse for reservoir properties.
WRITE DOWN the number of log-cycles on the time axis between the
"ENDWBS" line and the end of the test data (the above
figure shows a value of just under 1.5 log-cycles). We need this
value later!
Q: is the storage coefficient calculated from the unit-slope line between C(min) and C(max)?
A1: I don't know. I forgot to write down C(min) and C(max)...